Ichimoku Cloud strategy for gold marketThis strategy is based on main ichimoku features (Leading span , conversion line and base line) compared to cloud conditions.
I indicated all possibilities in this indicator and strategy decision is based on crossing factors of each main line through two other line confirmations.
Komut dosyalarını "Ichimoku Cloud " için ara

Ichimoku Cloud with Josh Olszewicz Crpyto Adjusted Settingslets you adjust your cloud to view higher timeframe cloud on lower timeframe by double or tripling timeframe

Ichimoku Cloud Signal ScoreAssociate various ichimoku signals with a score. For example, bullish signal => positive score, and bearish signal => negative score.
Signals from: ichimokutrader.com/signals.html
The scores of all the ichimoku signals are totalled up and plotted.

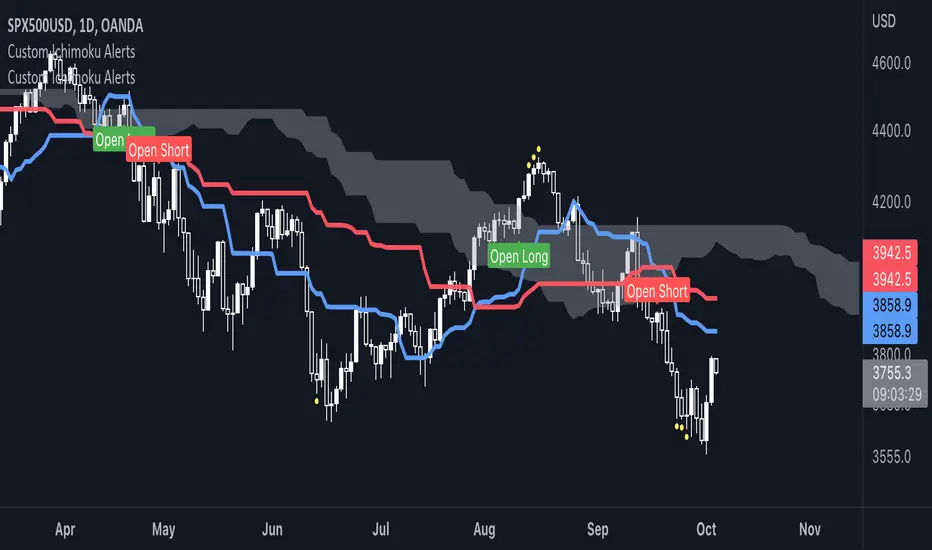
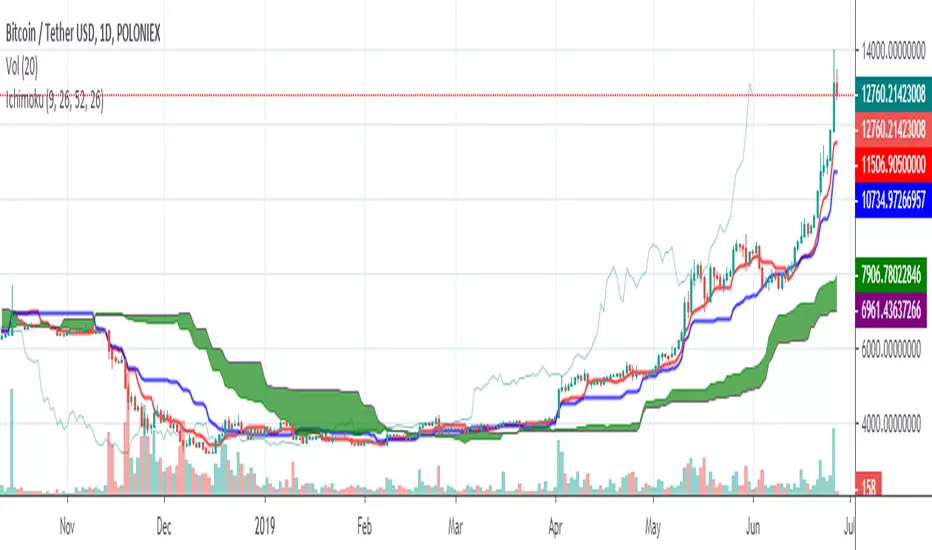
Ichimoku Cloud Anidjarcan be used in any timeframe
price crossing the cloud, buy or sell
blue line crossing red, attention to buy and sell
lagging line, inside prices, doing nothing, indicates trading, market consolidating.

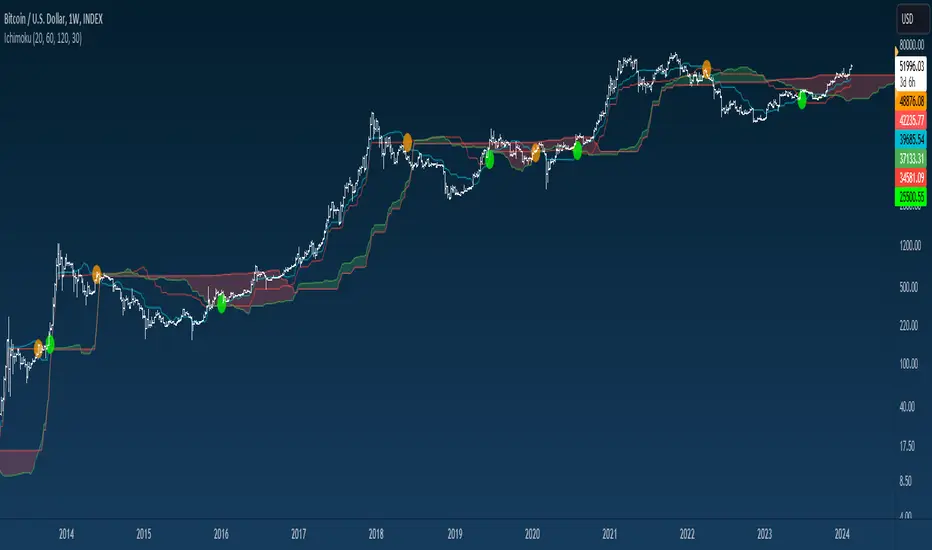
Ichimoku Buy & Sell SignalsIchimoku cloud with color coded circles to signal the cross of Tenkan and Kijun.
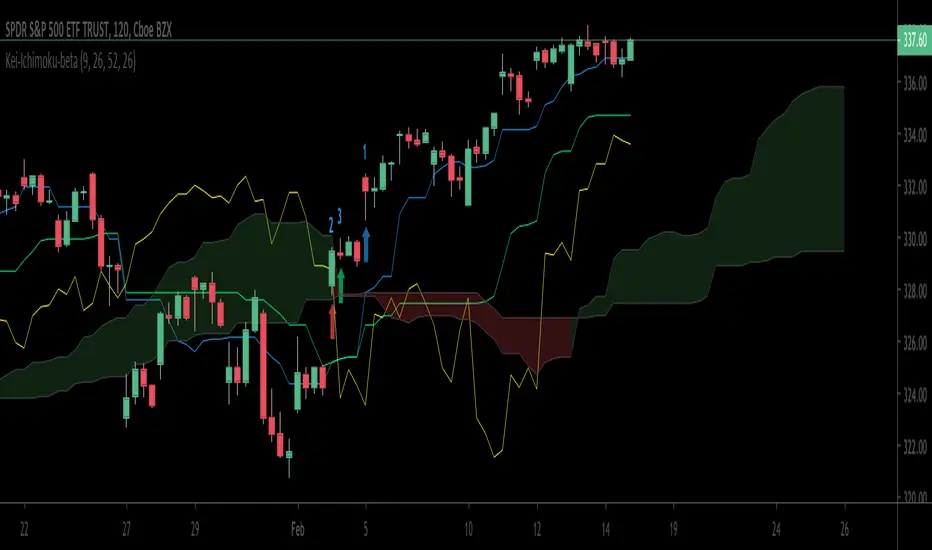
Ichimoku Cloud betaThis is a test version of Ichimoku, instead of plot chiko span backward 26 bars, it draws price at 26 bars backward at the current bar.
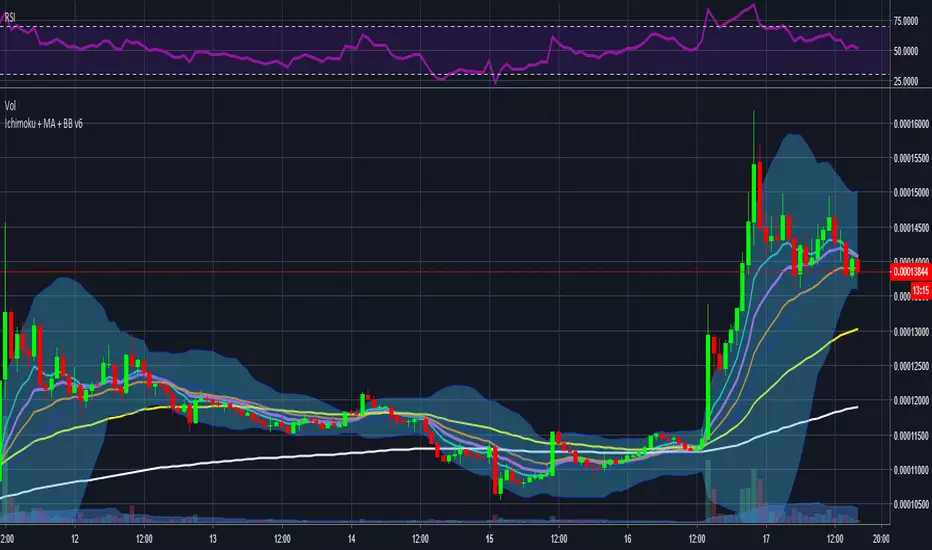
Ichimoku + Moving Average + Bollinger Bands v6Ichimoku cloud + bollinger bands + ema in one single script
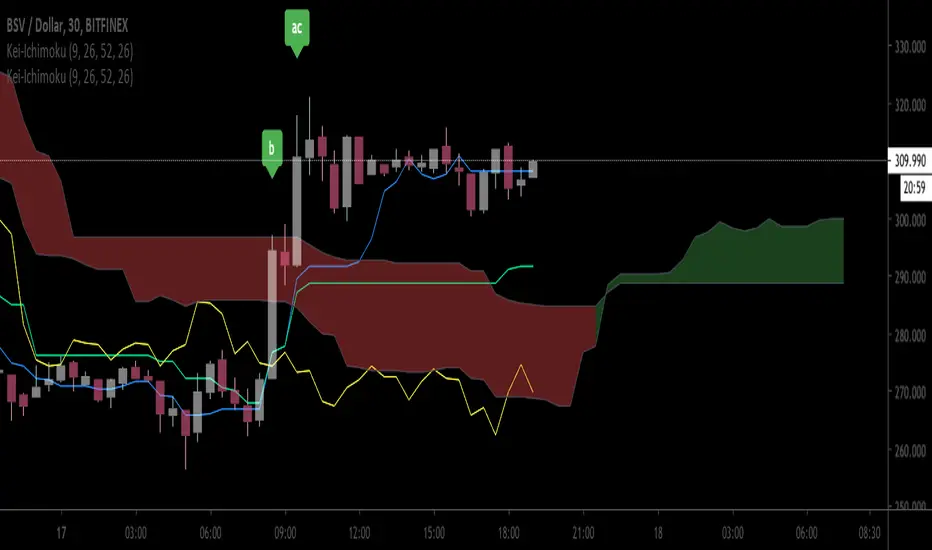
Ichimoku Cloud by Wei V1.3Label Sanyaku events, green for Gold and red for dead
- a: Tenkan sen Kijun Sen cross
- b: Chiko Span Cross Candle
- c: Kumo breakout
I also added a input option to draw chiko span differently. Original Chiko to draw Chiko as originally designed, and false to draw price at 25 bars earlier at current as "chiko span"

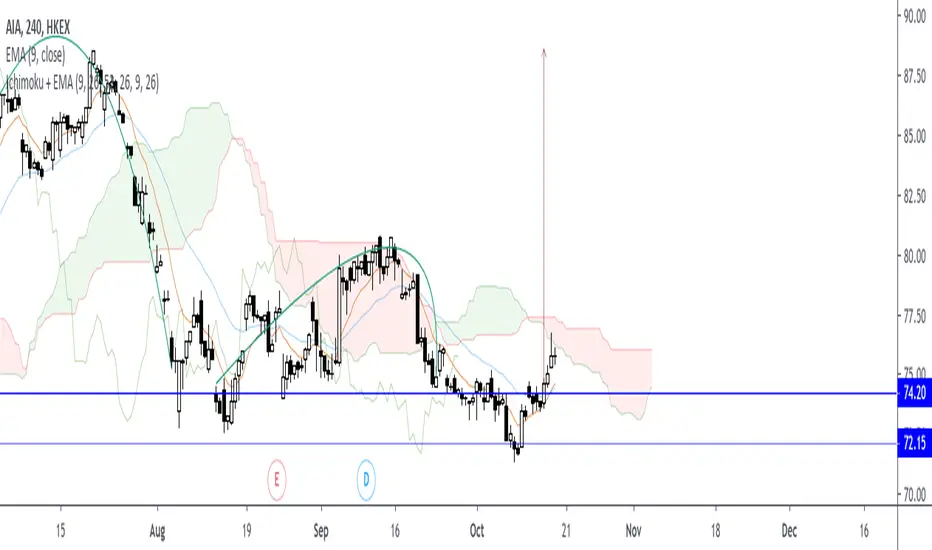
Ichimoku Cloud + EMA9,26instead of Base and Conversion, EMA9 and EMA26 is used to give more weight in recency of price movement

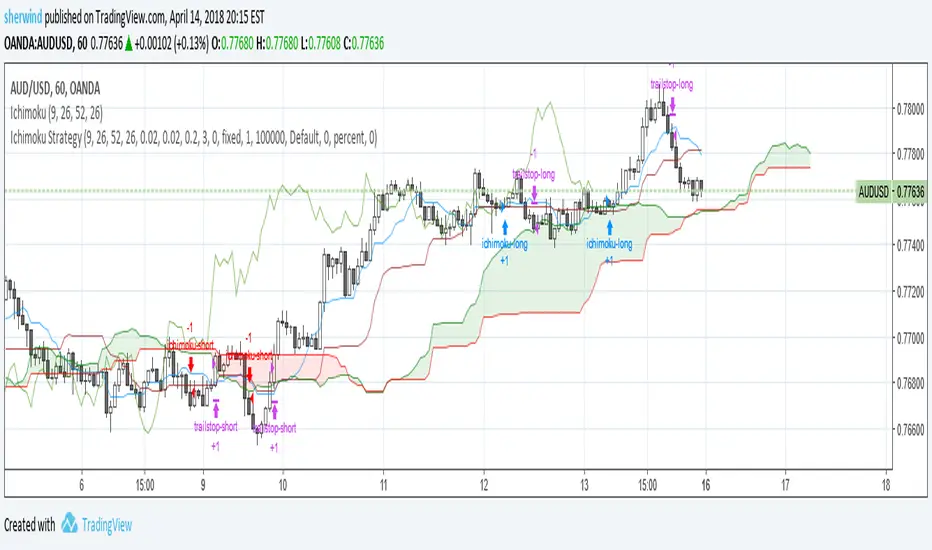
Ichimoku Cloud StrategyBased on the trading strategy described at
stockcharts.com
See Also:
- Backtesting and forwardtesting (of TradingView Strategies)
- 9 Mistakes Quants Make that Cause Backtests to Lie
- When Backtests Meet Reality
- Why MT4 backtesting does not work
Ichimoku Cloud Enhanced For CryptoIntervals have been changed to account for a 24/7 cryptocurrency trading period. Values were then doubled so that the trader can avoid fakeout breakouts/traps. This leads to a bit less signals but rather, more sure signals instead. Very useful and more safe, even in smaller timeframes. Colors were set to the standard and breakout arrows are now enabled by default.
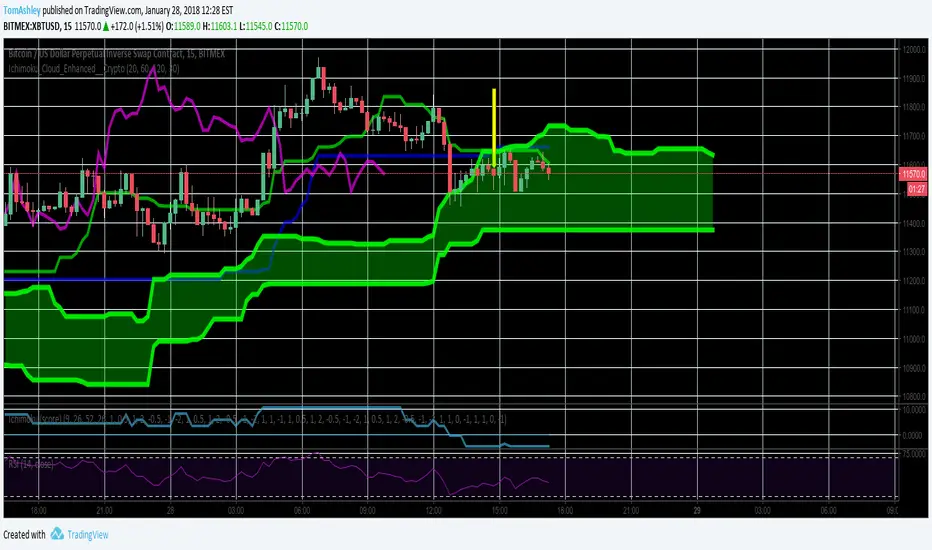


Ichimoku Cloud ALERT v1.1UPDATE!
Now it shows yellow bar when its sell signal and blue bar when its buy.
Ichimoku Oscillator With Divergences [ChartPrime]The Ichimoku Oscillator is a trading indicator designed to streamline the interpretation of Ichimoku clouds. It aims to refine and condense the complexities of the Chikou (the lag line), presenting its implications in real-time through an oscillator format, beneficial for those familiar with Ichimoku components but to have a new interpretation of their indicators.
The basics of an Ichimoku:
Conversion Line (Tenkan-Sen): It represents a midpoint of the highest and lowest prices over a specific period, usually 9 periods, reflecting short-term price movements.
Base Line (Kijun-Sen): It acts similarly to the Conversion Line but over a longer period, typically 26 periods, representing medium-term price movements.
Leading Span A & B (Kumo): Span A is the average of the Conversion Line and Base Line, and Span B is the midpoint of the highest and lowest prices over a usually longer period, typically 52 periods. Their interaction denotes trend direction, and the cloud color changes depending on whether Span A is above or below Span B, indicating bullish or bearish market conditions, respectively.
Lagging Span (Chikou Span): It is the current closing price plotted 26 periods behind, assisting in confirming the trend direction and potential momentum.
Advantage of an Oscillator:
Utilizing the oscillator format allows traders to interpret market dynamics more efficiently by visualizing the momentum and trend strength in a bounded range, enabling quick assessments of overbought or oversold conditions. Creating this oscillator provides multiple advantageous; particularly in sideway markets, helping to identify potential reversal points and offering insights on market entries and exits. When building this oscillator we've put a focus on unique interpretations such as overbought and sold areas and divergences; otherwise not found in traditional Ichimoku techniques. It is important to note these divergences are naturally not 100% real time.
When the oscillator turns green; the market is in an uptrend, red for downtrend and yellow for a transitioning market. The center line and the inner most cloud represent a balanced market state.
Key Features & Input Parameters:
Signal Source: Allows the selection of the price data source for signal generation, such as closing prices, and it’s the foundational parameter upon which the oscillator functions.
Normalization Settings: Users can select the normalization mode (“All”, “Window”, or “Disabled”), influencing how the oscillator scales its values. When enabled, it will scale from 100 to -100, allowing the user to understand better the relative positioning of price data.
Smoothing: This indicator offers advanced smoothing features, with options for additional smoothing, allowing traders to adjust the signal's sensitivity to price movements.
Kumo & Chikou Visibility: Traders can customize the visibility settings of Kumo and Chikou, tailoring the display of each component to their preference, enabling a cleaner and more intuitive view of market conditions.
Color Coding: Each component and condition, like bullish or bearish states, can be color-coded, providing visual cues to enhance the interpretability of market trends and states.
Color on Conversion: The oscillator provides an option to color the signal based on the crossover of the conversion and base lines.
Divergence: The oscillator can detect and highlight regular and hidden bullish and bearish divergences between the signal and price, aiding traders in identifying potential trend reversals or continuations.
Alerts:
The list of inbuilt alerts are provided below:
Inside Cloud: The signal line is inside the cloud.
Up Out of Cloud: The signal line crossed above the cloud.
Down Out of Cloud: The signal line crossed below the cloud.
Future Kumo Cross Bullish: The future Kumo lines have crossed in a bullish manner.
Future Kumo Cross Bearish: The future Kumo lines have crossed in a bearish manner.
Current Kumo Cross Bullish: The current Kumo lines have crossed in a bullish manner.
Current Kumo Cross Bearish: The current Kumo lines have crossed in a bearish manner.
Conversion Base Bullish: The conversion line crossed above the base line.
Conversion Base Bearish: The conversion line crossed below the base line.
Signal Bullish on Conversion Base: The signal line crossed above the maximum of conversion and base lines.
Signal Bearish on Conversion Base: The signal line crossed below the minimum of conversion and base lines.
Chikou Bullish: The Chikou line crossed above zero.
Chikou Bearish: The Chikou line crossed below zero.
Signal Over Max: The signal line crossed above the max level.
Signal Over High: The signal line crossed above the high level.
Signal Under Min: The signal line crossed below the min level.
Signal Under Low: The signal line crossed below the low level.
Chikou Over Max: The Chikou line crossed above the max level.
Chikou Over High: The Chikou line crossed above the high level.
Chikou Under Min: The Chikou line crossed below the min level.
Chikou Under Low: The Chikou line crossed below the low level.
Signal Crossover MA: The signal line crossed over the moving average.
Signal Crossunder MA: The signal line crossed under the moving average.
Regular Bullish Divergence: Regular bullish divergence detected.
Hidden Bullish Divergence: Hidden bullish divergence detected.
Regular Bearish Divergence: Regular bearish divergence detected.
Hidden Bearish Divergence: Hidden bearish divergence detected.
Bounce off of Kumo Up: Bullish Bounce off of Kumo.
Bounce off of Kumo Down: Bearish Bounce off of Kumo.
By providing a cohesive visualization of the Ichimoku elements and market momentum within a bounded range, this oscillator is a unique tool and insight into markets.

Ichimoku by FarmerBTCLegal Disclaimer
This strategy, "Ichimoku by FarmerBTC," is provided for educational and informational purposes only. It does not constitute financial advice and should not be relied upon as such. Trading and investing involve substantial risk, including the potential for losing more than your initial investment. Past performance is not indicative of future results. Always consult with a qualified financial advisor before making trading or investment decisions. The author of this strategy is not responsible for any financial losses incurred through its use.
Overview
The "Ichimoku by FarmerBTC" strategy is a trend-following system built on the Ichimoku Cloud indicator, enhanced with volume analysis and a high-timeframe Simple Moving Average (HTF SMA) condition. It is designed to identify long-only trade opportunities and performs optimally on higher timeframes, such as the daily chart or above.
Core Components
1. Ichimoku Cloud
The Ichimoku Cloud is a comprehensive trend-following indicator that helps identify the overall market direction and momentum. It consists of:
Conversion Line (Tenkan-Sen): Measures short-term momentum.
Base Line (Kijun-Sen): Filters medium-term trends.
Leading Span A: The average of the Conversion and Base Lines, forming one cloud boundary.
Leading Span B: The midpoint of the highest high and lowest low over a longer period, forming the other cloud boundary.
Key Ichimoku Rules Applied:
The strategy identifies bullish trends when:
The price is above the cloud.
The cloud is bullish (Leading Span A > Leading Span B).
2. High-Timeframe Simple Moving Average (HTF SMA)
This condition ensures alignment with the broader trend:
Default SMA Length: 13 periods.
Default Timeframe: 1 day.
HTF SMA Rule:
Trades are allowed only when the price is above the HTF SMA, ensuring alignment with the larger trend.
3. Volume Analysis
The strategy uses volume to validate trade setups:
Volume MA: A 20-period moving average of volume is calculated.
Trades are allowed only when the current volume is at least 1.5x the Volume MA, indicating strong market participation.
Entry and Exit Rules
Entry Condition (Long Only):
Price above the Ichimoku Cloud: Confirms a bullish trend.
Bullish Cloud: Leading Span A > Leading Span B indicates upward momentum.
Price above the HTF SMA: Ensures alignment with the broader trend.
Volume exceeds threshold: Confirms strong market participation.
Exit Condition:
The strategy exits the position when the price moves below the Ichimoku Cloud, signaling a potential trend reversal.
Best Timeframes
This strategy is optimized for daily (1D) or higher timeframes (e.g., weekly 1W). Using it on lower timeframes may produce false signals due to increased noise in price and volume data.
Default Settings
Ichimoku Settings:
Conversion Line Period: 10
Base Line Period: 30
Lagging Span Period: 53
Displacement: 26
HTF SMA Settings:
SMA Length: 13
Timeframe: 1 Day
Volume Settings:
Volume MA Length: 20
Volume Multiplier: 1.5x
Visualization
Ichimoku Cloud:
Dynamic cloud coloring (green for bullish, red for bearish) helps identify the current trend.
HTF SMA:
A purple line overlays the chart, providing a clear representation of the high-timeframe trend.
Volume Panel:
An optional panel displays volume (blue histogram) and the Volume Moving Average (orange line) to analyze market participation.
Advantages of This Strategy
High Accuracy on Higher Timeframes:
Filtering trades using the Ichimoku Cloud, HTF SMA, and volume ensures robust trend alignment, reducing false signals.
Volume Confirmation:
Incorporates volume as a validation metric to enter trades only during strong market participation.
Easy Customization:
Parameters like Ichimoku periods, SMA length, timeframe, and volume thresholds can be adjusted to suit different assets or trading styles.
Limitations
Not Suitable for Low Timeframes:
Lower timeframes can produce excessive noise, leading to false signals.
Long-Only:
The strategy is designed only for bullish markets and does not support short trades.
Lagging Nature of Indicators:
Both the Ichimoku Cloud and SMA are lagging indicators, meaning they react to past price movements.
Conclusion
The "Ichimoku by FarmerBTC" strategy is an excellent tool for trend-following on daily or higher timeframes. Its combination of Ichimoku Cloud, high-timeframe SMA, and volume ensures a robust framework for identifying high-probability long trades in trending markets. However, users are advised to test the strategy thoroughly and manage their risk appropriately. Always consult with a financial professional before making trading decisions.
